


An activity log in software testing captures every meaningful event across your test lifecycle. Without one, your team is debugging blind — chasing defects with no context on who did what or when. A well-structured activity log gives you a reliable system audit trail that connects actions to outcomes. It supports traceability, compliance, and faster root-cause analysis. In this article, you will learn how to design, implement, and maintain activity logs that actually work for QA teams. We cover practical schemas, retention policies, tool comparisons, and common anti-patterns to avoid. By the end, you will have a repeatable playbook you can apply to your next sprint.
What Is an Activity Log?
An activity log is a chronological record of events, actions, and state changes that occur within a system or across a test process. In software testing, it functions as a user action history that documents everything from test case execution and environment changes to access events and configuration updates.
Think of it as your project's flight recorder. When something goes wrong — a failed regression suite, an unexpected environment crash, a disputed test result — the activity log gives you the objective sequence of events leading up to the incident.
Why It Matters for QA
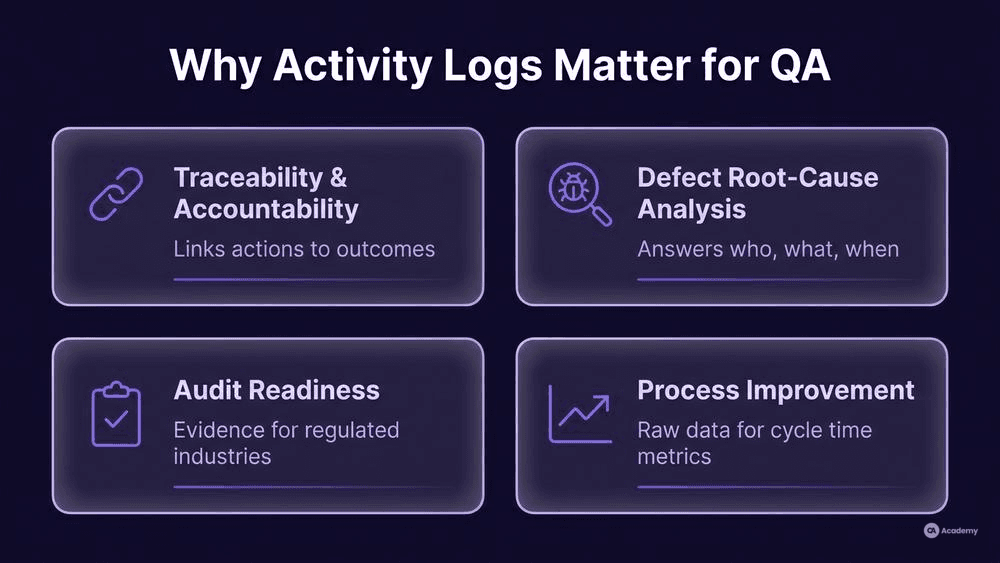
Activity logs are not just a "nice to have" for compliance audits. They are operational infrastructure that directly impacts your team's effectiveness in several ways.
Traceability and accountability. ISO/IEC/IEEE 29119-3 defines test documentation requirements that include maintaining records of test execution and results [1]. An activity log extends this by capturing the surrounding context — who triggered the execution, what environment configuration was active, and which build was under test.
Defect root-cause analysis. When a defect appears in production, your first question is: "Did we test this?" Your second question is: "What happened during that test?" An access history timestamp in your logs answers both questions in seconds instead of hours.
Audit readiness. Regulated industries (automotive, medical devices, finance) require demonstrable evidence of testing activities. Automotive SPICE, for example, explicitly assesses whether test activities are documented and traceable to requirements [2]. Your activity log is the backbone of that evidence.
Process improvement. The TMMi framework emphasizes measurement and analysis of test processes as a maturity indicator [3]. Event tracking records give you the raw data to measure cycle times, identify bottlenecks, and track process adherence over time.
How to Implement Activity Logs in Your Test Process
Prerequisites and Setup
Before you start logging, define three things clearly.
Scope. Decide what events you need to capture. At a minimum, log test execution events (start, pass, fail, block), environment changes, configuration modifications, and user access events. Avoid the temptation to log everything — you will drown in noise.
Schema. Standardize your log format. Every entry should contain a consistent set of fields so logs are machine-parseable and human-readable. Here is a practical schema you can adapt:
Field | Description | Example |
|---|---|---|
| ISO 8601 with timezone |
|
| User or system identity |
|
| What happened |
|
| Object acted upon |
|
| Outcome |
|
| Environment, build, config |
|
| Links related events |
|
| Log level |
|
A correlation ID is simply a shared identifier that ties together all log entries belonging to the same logical operation — for example, all events from a single test suite run. It lets you reconstruct the full sequence when filtering logs.
Retention policy. Define how long you keep log data. This is not optional — it is a compliance and storage decision. More on this in the Best Practices section.
Step 1: Instrument Your Test Framework
Most modern test frameworks support event hooks or listeners that fire on test lifecycle events. Use these to emit structured log entries automatically rather than relying on manual logging. Manual approaches typically degrade in quality and coverage over time as teams get busy and skip entries.
A minimal example using a test listener pattern:
# pytest conftest.py — automatic activity log emission
import json, datetime

def pytest_runtest_logreport(report):
    if report.when == "call":
        entry = {
            "timestamp": datetime.datetime.now(datetime.timezone.utc).isoformat(),
            "actor": "ci-pipeline",
            "action": "EXECUTE_TEST",
            "target": report.nodeid,
            "result": report.outcome.upper(),
            "context": {"phase": report.when}
        }
        with open("activity_log.jsonl", "a") as f:
            f.write(json.dumps(entry) + "\n")
This emits one JSON line per test execution. You can extend it with environment metadata, build numbers, and correlation IDs from your CI/CD pipeline.
Step 2: Capture Environment and Configuration Changes
Test results are meaningless without environment context. Log every change to your test environment — deployments, configuration updates, database refreshes, service restarts. Tie these to the same correlation ID as the test executions they affect.
Step 3: Centralize and Protect Logs
Ship logs to a central, append-only store. This is critical for both security and usability. OWASP identifies logging and monitoring failures as a significant web application security risk [4]. If your activity logs are mutable (editable or deletable), they lose their value as an audit trail.
Step 4: Build Queryable Dashboards
Raw logs are useless if nobody looks at them. Create dashboards that surface key signals: test execution trends over time, environment change frequency, unusual access patterns, and failure clusters. This turns your system audit trail from a compliance artifact into an operational tool.
Best Practices for Activity Logs
Use structured formats. JSON Lines (.jsonl) or structured syslog formats are machine-parseable. Avoid free-text logs — they are almost impossible to query at scale.
Automate everything. Every log entry that can be emitted automatically should be. Reserve manual logging for exceptional events like exploratory testing session notes or incident observations.
Apply consistent severity levels. Use standard levels (DEBUG, INFO, WARN, ERROR, FATAL) consistently. Test execution results map to INFO (pass) and ERROR (fail). Environment failures map to FATAL. Configuration changes map to WARN.
Define log data retention policies. How long you keep logs depends on your domain and regulatory requirements. Here is a starting framework:
Log Category | Suggested Retention | Rationale |
|---|---|---|
Test execution logs | 12-24 months | Covers typical release and audit cycles |
Security/access logs | 36+ months | Regulatory requirements (SOX, HIPAA, PCI-DSS) |
Environment change logs | 12-18 months | Supports post-release defect investigation |
Debug/verbose logs | 30-90 days | High volume, low long-term value |
Adjust these based on your organization's policies and regulatory context. The key is to have an explicit, documented policy rather than keeping everything indefinitely or deleting arbitrarily.
Include correlation IDs. Without them, you cannot reconstruct a sequence of related events. Generate a unique ID at the start of each logical operation (test suite run, deployment pipeline, investigation session) and propagate it through all related log entries.
Make logs immutable. Once written, log entries must not be modifiable. Use append-only storage, write-once buckets, or log management systems with tamper-evident features. Mutable logs are not logs — they are drafts.
What NOT to Do: Common Anti-Patterns
Knowing what to avoid often saves more time than knowing what to do. Here are the most common mistakes QA teams make with activity logs.
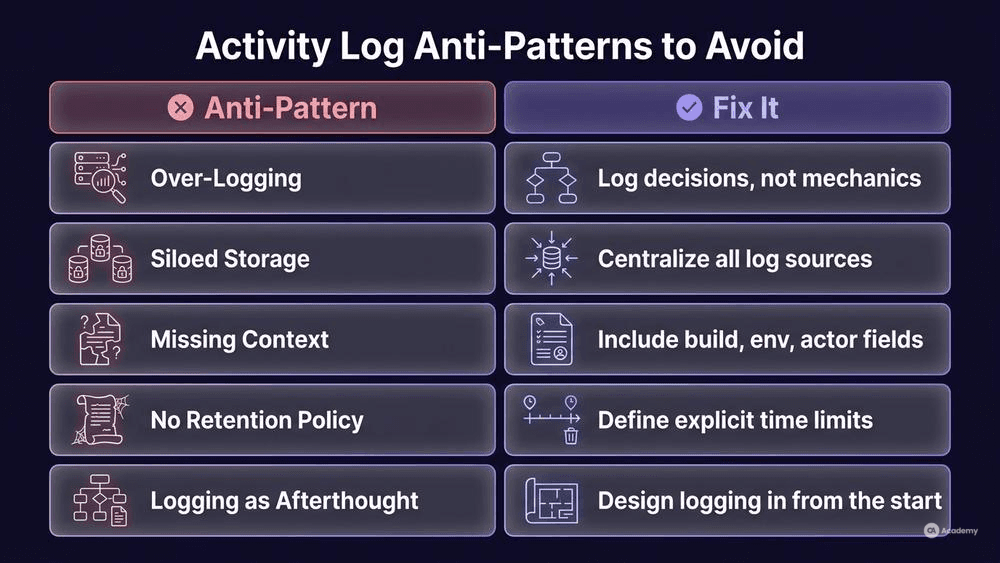
Over-logging. Capturing every mouse click, every HTTP request, and every variable state creates massive volumes that obscure meaningful signals. Log decisions and outcomes, not mechanics. If your log file grows faster than your test suite runs, you are logging too much.
Siloed storage. When test execution logs live in your test management tool, environment logs live in your CI/CD platform, and access logs live in your identity provider — and none of them talk to each other — your system audit trail is fragmented. You need a centralized or federated approach where logs from all sources are queryable together.
Missing context. A log entry that says FAIL — TC-4021 is nearly useless. Which build? Which environment? Which dataset? Which user triggered it? If you cannot answer these questions from the log entry alone, your schema is incomplete.
No retention policy. Keeping everything forever is expensive and creates legal risk (you may be obligated to produce logs in litigation). Deleting too aggressively means losing evidence you need for post-release investigations. Both extremes cause problems.
Treating logs as optional. When logging is an afterthought — bolted on after the test framework is built — it is always incomplete. Design logging into your test architecture from the start, just as ISO/IEC/IEEE 29119-2 positions test monitoring and control as an integral part of the test process, not an add-on [5].
Tools Comparison
Here is a practical comparison of tools that QA teams commonly use for activity log management. Each tool listed below is a real, widely-used product; verify features against the vendor's current documentation before making decisions.
Tool | Primary Use Case | Log Format | QA Relevance | Open Source |
|---|---|---|---|---|
ELK Stack (Elasticsearch, Logstash, Kibana) | Full-text search and visualization of logs | JSON, syslog, custom | Dashboard-driven test result analysis, environment event correlation | Yes |
Grafana Loki | Lightweight log aggregation paired with Grafana | LogQL queries over label-indexed logs | Cost-effective for teams already using Grafana for metrics | Yes |
Splunk | Enterprise log management and SIEM | Any structured/unstructured | Compliance reporting, security audit trails, advanced analytics | No |
Datadog | Unified observability (logs + metrics + traces) | JSON, syslog | Correlating test environment performance with test outcomes | No |
Azure Monitor / Log Analytics | Cloud-native log management (Azure ecosystem) | KQL queries over structured logs | Integrated with Azure DevOps pipelines for CI/CD log correlation | No |
Allure TestOps | Test management with built-in execution history | Allure-format reports | Direct test execution event tracking records with trend analysis | No (SaaS) |
How to choose: If your team is already invested in a specific ecosystem (Azure, AWS, Grafana), extend it rather than introducing a new tool. If you need regulatory-grade audit trails, prioritize immutability features and access controls — Splunk and Datadog offer these out of the box. For smaller teams or open-source-first organizations, ELK or Loki provides strong capabilities at lower cost.
Real-World Example
⚠️ Disclaimer: The following scenario is an illustrative example based on typical industry patterns. The specific metrics are hypothetical estimates designed to demonstrate realistic outcomes, not measured data from a documented project. They should not be cited as factual benchmarks.
Context
A mid-size fintech QA team (12 testers, 4 SDETs) runs approximately 8,000 automated tests nightly across three environments (staging, pre-production, integration). They also execute roughly 200 manual exploratory testing sessions per sprint. Their test infrastructure spans two CI/CD pipelines, a shared database, and multiple microservices.
Challenge
When production incidents occurred, the team typically spent 3-4 hours per incident reconstructing what happened during testing. Key problems included: test results stored only in CI pipeline outputs (lost after 14 days), no record of environment changes between test runs, and no way to correlate a failed test with the specific service version deployed at the time. During an external audit, the team could not demonstrate full test coverage traceability for two critical regulatory features.
Solution
The team implemented a centralized activity logging strategy using the ELK Stack with the following practical steps:
- Standardized schema — adopted the log schema described earlier in this article, with mandatory correlation IDs linking each test run to its deployment pipeline.
- Automated emission — instrumented their pytest and Cypress frameworks with event listeners that emitted structured log entries on every test lifecycle event.
- Environment change capture — added deployment hooks that logged every service version change, database migration, and configuration update to the same central index.
- Retention policy — defined 18-month retention for execution logs, 36-month for access and security events, and 60-day for debug-level output.
- Dashboards — built Kibana dashboards showing test pass/fail trends by build, environment stability metrics, and audit-ready traceability reports.
Results
After three sprints of implementation and refinement, the team observed the following illustrative improvements:
- Incident investigation time dropped from 3-4 hours to approximately 30-45 minutes (roughly 80% reduction) because the full event sequence was immediately queryable.
- Audit preparation effort decreased by an estimated 70%, as traceability reports could be generated directly from log queries instead of assembled manually.
- Flaky test root-cause identification improved — the team identified that approximately 60% of their flaky failures correlated with environment configuration changes logged between test runs, which had previously been invisible.
Key Takeaways
- Centralized, structured logging transforms incident investigation from guesswork into systematic querying.
- Correlation IDs are the single most impactful schema element — without them, logs are just a pile of timestamped events.
- The biggest effort is not tooling — it is getting the team to agree on a consistent schema and enforce it across all test activities.