



Your team ships code three times a week. Functional tests pass. The deployment looks clean. Then, under real user load, response times spike and the checkout flow grinds to a halt. The root cause is almost never a surprise — performance testing was skipped or run manually, days after the code merged. Apache JMeter, when wired directly into your CI/CD pipeline, catches these regressions before they reach production. This article walks you through the practical setup: building a reliable JMeter test plan, automating it in your pipeline, and interpreting results so your team can ship with confidence. You will find step-by-step workflows, a tools comparison, common pitfalls, and a model scenario you can adapt to your own context.
What Is JMeter?
Apache JMeter is an open-source, Java-based tool designed for load testing, performance testing, and functional testing of web applications, APIs, databases, and other services. It simulates multiple users sending requests concurrently, letting you measure throughput, response time, and error rates under controlled conditions.
JMeter runs in two modes: a GUI mode for building and debugging test plans, and a non-GUI (command-line) mode optimized for execution in automated environments. This dual-mode design makes it a natural fit for CI/CD workflows — you design in the GUI, then execute headlessly in the pipeline.
Why It Matters for QA
Performance defects found in production tend to be among the most expensive to fix. According to the ISO/IEC 25010 quality model, performance efficiency — covering time behaviour, resource utilization, and capacity — is a core product quality characteristic [1]. Yet many teams still treat performance testing as an afterthought, running it manually in a staging environment days or weeks after a code change.
Integrating JMeter into your pipeline shifts performance validation left. Instead of discovering a slow query or a memory leak in a release-candidate environment, you catch it on the same commit that introduced it.
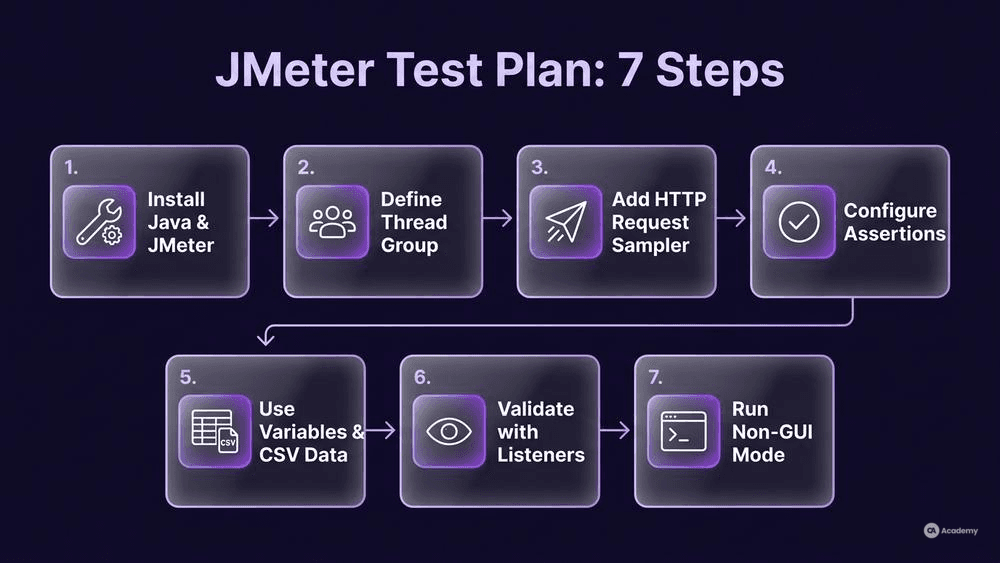
How to Build and Automate a JMeter Test Plan
Prerequisites and Setup
Before you wire JMeter into a pipeline, you need a working local setup. Here is a minimal checklist:
- Java: JMeter requires Java 8 or later. Verify with
java -version. - JMeter binary: Download the latest stable release from apache.org/jmeter. Unzip it — no installer needed.
- Environment variable: Add JMeter's
/bindirectory to your systemPATHso you can invokejmeterfrom any terminal. - On Windows: Extract the archive, open System Properties → Environment Variables, and append the
binpath. Confirm withjmeter --versionin a new terminal window.
Once JMeter launches in GUI mode, you are ready to build your first test plan.
Step 1 — Define the JMeter Thread Group
A JMeter thread group represents a pool of virtual users. Right-click your Test Plan → Add → Threads → Thread Group. Configure three fields:
- Number of Threads: How many concurrent users to simulate (start with 10–50 for a baseline).
- Ramp-Up Period: How many seconds JMeter takes to start all threads. A 10-thread group with a 20-second ramp-up adds one user roughly every two seconds.
- Loop Count: How many times each thread repeats the test. Set to 1 for a single pass, or check Infinite for duration-based runs.
Keep your initial thread group small. A common mistake is jumping straight to hundreds of threads without validating the test plan logic first.
Step 2 — Add the HTTP Request Sampler
Inside your thread group, add an HTTP Request sampler (Add → Sampler → HTTP Request). This element defines the actual request JMeter sends.
- Protocol:
https(orhttpfor internal services). - Server Name or IP: Your target host, e.g.,
api.staging.example.com. - HTTP Method: GET, POST, PUT, etc.
- Path: The endpoint, e.g.,
/api/v2/orders.
For POST/PUT requests, add body data in JSON or form format under the Body Data tab. If your API requires authentication tokens, add an HTTP Header Manager as a child element and set Authorization: Bearer ${token}.
Step 3 — Configure Assertions in JMeter
Assertions validate that responses meet your expected criteria — they are the pass/fail gates of your test. Add a Response Assertion to check:
- Response code: Equals
200(or the expected status). - Response body: Contains a required string, e.g.,
"status":"ok". - Response time: Use a Duration Assertion to flag any response exceeding your threshold (e.g., 2000 ms).
Without assertions, a JMeter test will report results but will not distinguish between a correct and an incorrect response. In a pipeline context, this means a broken endpoint could pass silently.
Step 4 — Use Variables in JMeter for Flexibility
Hard-coding values (hostnames, credentials, thread counts) into your test plan makes it brittle across environments. Use JMeter variables to parameterize:
- User Defined Variables: Add at the Test Plan level. Define
BASE_URL,THREAD_COUNT,RAMP_UP. - CSV Data Set Config: Feed test data (usernames, product IDs) from an external CSV file.
- Property Override: Pass values from the command line at execution time:
jmeter -JBASE_URL=api.staging.example.com -JTHREAD_COUNT=50.
This approach means the same .jmx file works across dev, staging, and pre-production without manual edits.
Step 5 — Validate with Listener View Results
In the GUI, add a View Results Tree listener to inspect individual request/response pairs. This is your debugging tool — check headers, body content, and assertion outcomes. Also add a Summary Report listener for aggregate metrics (average response time, throughput, error percentage).
Important: Remove or disable listeners before running in the pipeline. Listeners consume significant memory and CPU during non-GUI execution, and results should be written to files instead.
Step 6 — Run in Non-GUI Mode
Execute your finalized test plan from the command line:
bash jmeter -n -t test-plan.jmx -l results.jtl -e -o ./report-n: Non-GUI mode.-t: Path to your test plan.-l: Output file for raw results.-e -o: Generate an HTML dashboard report.
Step 7 — Integrate into Your CI/CD Pipeline
In your pipeline configuration (Jenkins, GitLab CI, GitHub Actions), add a stage that:
- Installs or unpacks JMeter (or uses a Docker image like
justb4/jmeter). - Runs the non-GUI command with environment-specific property overrides.
- Parses the results file and fails the build if error rate or response time exceeds your team's agreed threshold.
A Jenkins pipeline snippet:
groovy stage('Performance Test') { steps { sh ''' jmeter -n \ -t tests/perf/api-load.jmx \ -l results/perf-results.jtl \ -JBASEURL=${STAGINGHOST} \ -JTHREAD_COUNT=50 ''' } post { always { perfReport sourceDataFiles: 'results/perf-results.jtl' } } }The perfReport step (from the Jenkins Performance Plugin) parses results and can mark the build as unstable or failed based on configurable thresholds. Define those thresholds based on your team's risk tolerance — for example, fail the build if any critical transaction exceeds its agreed response-time ceiling or if the overall error rate crosses a level the team has deemed unacceptable.
Best Practices for Pipeline Integration
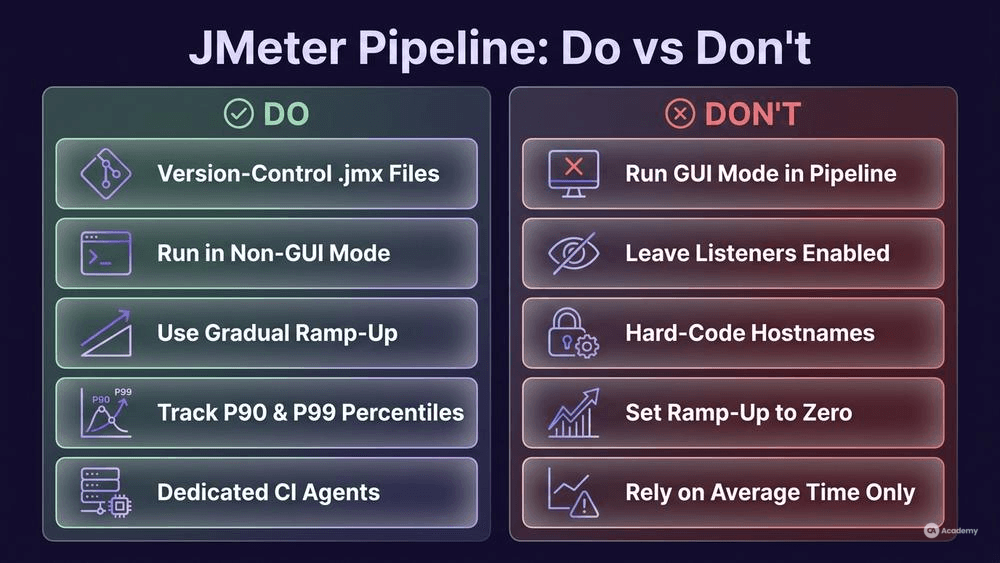
- Version-control your `.jmx` files. Store test plans alongside application code. Changes to the test plan should go through the same review process as production code.
- Keep test plans modular. Separate login flows, API calls, and data setup into reusable test fragments. This reduces duplication and simplifies maintenance.
- Use realistic but bounded data. Feed representative data via CSV files, but keep data sets small enough that tests complete within your pipeline's time budget.
- Set explicit timeouts. A runaway JMeter process can block your pipeline. Configure both JMeter's test duration and your CI tool's stage timeout.
- Trend, do not just gate. In addition to pass/fail thresholds, publish response-time trends across builds. A gradual 15% slowdown over ten builds signals a problem that a static threshold might miss.
- Run on dedicated agents. JMeter load generation competes for CPU and memory. Running it on the same agent as your build introduces noise. Use dedicated or appropriately sized runners.
What Not to Do
- Do not run JMeter in GUI mode in the pipeline. GUI mode is for design and debugging only. In a headless CI environment, it will typically fail or produce unreliable results.
- Do not leave listeners enabled in automated runs. Listeners like View Results Tree write every response to memory. At scale, this can exhaust available memory and skew results.
- Do not treat the recorded script as production-ready. If you record a JMeter script using the HTTP(S) Test Script Recorder, expect to refactor it. Recorded scripts typically capture hard-coded session tokens, redundant requests, and environment-specific values that need manual refinement before they are reliable.
- Do not ignore ramp-up configuration. Setting ramp-up to zero sends all threads simultaneously, which tests spike behaviour — not typical load. Unless spike testing is your intent, use a gradual ramp-up that reflects realistic user arrival patterns.
- Do not chase a single metric. Average response time alone hides outliers. Track P90 and P99 percentiles alongside average and error rate for a more complete picture.
Tools Comparison
Feature | JMeter | k6 | Gatling | Locust |
|---|---|---|---|---|
Language | Java (XML test plans) | JavaScript | Scala / Java | Python |
Protocol Support | HTTP, JDBC, FTP, SOAP, JMS, LDAP | HTTP, WebSocket, gRPC | HTTP, WebSocket | HTTP, custom |
GUI | Full GUI for design | None (code-only) | Recorder + code | Web-based dashboard |
CI/CD Integration | CLI + plugins (Jenkins, GitLab) | Native CLI, Docker | CLI + Maven/Gradle/sbt | CLI + Docker |
Distributed Testing | Built-in primary/worker mode | Cloud-native (k6 Cloud) | Requires manual setup | Built-in distributed mode |
Learning Curve | Moderate (GUI helps) | Low (JS developers) | Moderate-High (Scala) | Low (Python developers) |
Resource Consumption | Higher (JVM-based) | Lower (Go engine) | Moderate (JVM) | Lower (Python coroutines) |
Best For | Protocol diversity, existing Java teams | Developer-centric perf testing | High-throughput HTTP scenarios | Quick scripting, Python teams |
JMeter's primary advantage is its breadth of protocol support and its mature ecosystem of plugins. If your stack includes JDBC connections, JMS queues, or LDAP directories alongside HTTP APIs, few tools match JMeter's out-of-the-box coverage. For teams working primarily with HTTP/REST and comfortable writing code, k6 or Gatling may offer a leaner workflow.
Real-World Example
⚠️ Disclaimer: The following scenario is an illustrative example based on typical industry patterns. The specific metrics are hypothetical estimates designed to demonstrate realistic outcomes, not measured data from a documented project. They should not be cited as factual benchmarks.
Context
Consider a mid-sized e-commerce platform running a microservices architecture with 12 backend services. The QA team of six testers runs functional regression suites in the CI/CD pipeline, but performance testing happens manually — roughly once per release cycle, which is every three weeks.
Challenge
Performance issues (slow search queries, checkout timeouts under moderate load) were routinely discovered in the staging environment during manual performance runs, often just days before a planned release. The illustrative defect-escape pattern looked like this: approximately 40% of performance-related bugs were found only during manual pre-release testing or, worse, after deployment. Each late discovery typically required a hotfix cycle, delaying the release.
Solution
The team integrated JMeter into their GitLab CI pipeline using the following approach:
- Identified critical paths: Checkout, search, and authentication — three user flows representing the highest business risk.
- Built parameterized JMeter test plans: Using variables for environment-specific configuration and CSV data sets for test accounts.
- Added assertions: Response-time Duration Assertions on each critical transaction, plus Response Assertions validating expected payloads.
- Configured pipeline stages: JMeter ran in non-GUI mode on a dedicated runner after functional tests passed. Results were parsed by a custom script that failed the pipeline if any critical transaction exceeded its agreed ceiling.
- Published trends: Response-time percentiles (P90, P95) were tracked across builds via a Grafana dashboard fed by JMeter's JTL output.
Results (Illustrative)
After adopting this approach, the team observed the following illustrative patterns:
- Pipeline detection of performance regressions rose from an estimated 30% to roughly 85%, meaning most performance issues were caught in the same build that introduced them.
- Pre-release performance testing cycle dropped from an illustrative three days of manual testing to an automated 25-minute pipeline stage.
- Late-stage performance hotfixes decreased by an estimated 70%, reducing release delays attributable to performance defects.
Key Takeaways
- Start with critical user paths. You do not need to performance-test every endpoint on day one. Focus on high-risk, high-traffic flows.
- Parameterize from the start. Hard-coded test plans become a maintenance burden across environments.
- Trend over time, not just pass/fail. A gradual response-time increase across builds reveals problems that a static threshold alone will miss.
- Dedicated infrastructure matters. Running load tests on shared build agents produces noisy, unreliable results.